
How Much Can You Make Selling on Amazon India? Profit and Ad Budget Guide

Updated: Aug 10

How much you can make selling on Amazon India depends on your selling price, product cost, Amazon fees, conversion rate, advertising cost and achievable order volume. Revenue alone does not show earning potential. Sellers should first calculate profit per order, break-even advertising cost and realistic sales volume before deciding how much to spend or scale.
A product may generate ₹10 lakh in monthly revenue and still lose money. Another product may produce only ₹3 lakh in sales but create a healthier contribution profit.
That is why the right question is not simply:
“How much can I sell on Amazon?”
The better question is:
"How many orders can I generate profitably, and how much cash will I need to reach that volume?"
This guide explains how to answer that question using data available from Amazon Seller Central, advertising reports, keyword tools and your own cost records.
Key Takeaways from How Much Can You Make Selling on Amazon India
Amazon seller profit is the money remaining after product costs, marketplace fees, advertising and other variable expenses—not total sales revenue.
Calculate contribution margin per order before deciding what ACoS, CPC or advertising budget you can afford.
Estimate advertising CPA by dividing average CPC by conversion rate.
Do not treat category search volume as guaranteed traffic or revenue; adjust it for your obtainable impressions, clicks and conversions.
Build conservative, base and optimistic scenarios before committing inventory or advertising cash.
Revenue Is Not the Same as Amazon Seller Profit
Revenue is the total value of orders generated. Profit is what remains after costs.

For an Amazon seller, revenue may need to cover:
Manufacturing or procurement
Packaging
Inbound logistics
Amazon referral and closing fees
Fulfilment or shipping
Storage
Advertising
Discounts and coupons
Returns and damaged stock
Business overheads
Applicable taxes
Amazon India’s published fee structure separates referral fees, closing fees, shipping or weight-handling fees and other applicable charges. Amazon’s own profitability formula subtracts product cost and total selling fees from the sale price. The exact charges vary according to factors such as product category, price and fulfilment method.
Therefore, using one universal assumption such as “Amazon takes 30%” may be suitable for an early rough estimate, but it is not reliable enough for a final product decision.
A high-revenue product is not necessarily a high-profit product. Profitability depends on how much money remains after every order is fulfilled and acquired.
Four Questions Every Amazon Seller Should Answer
A useful financial model separates four different questions.
1. How much demand exists?
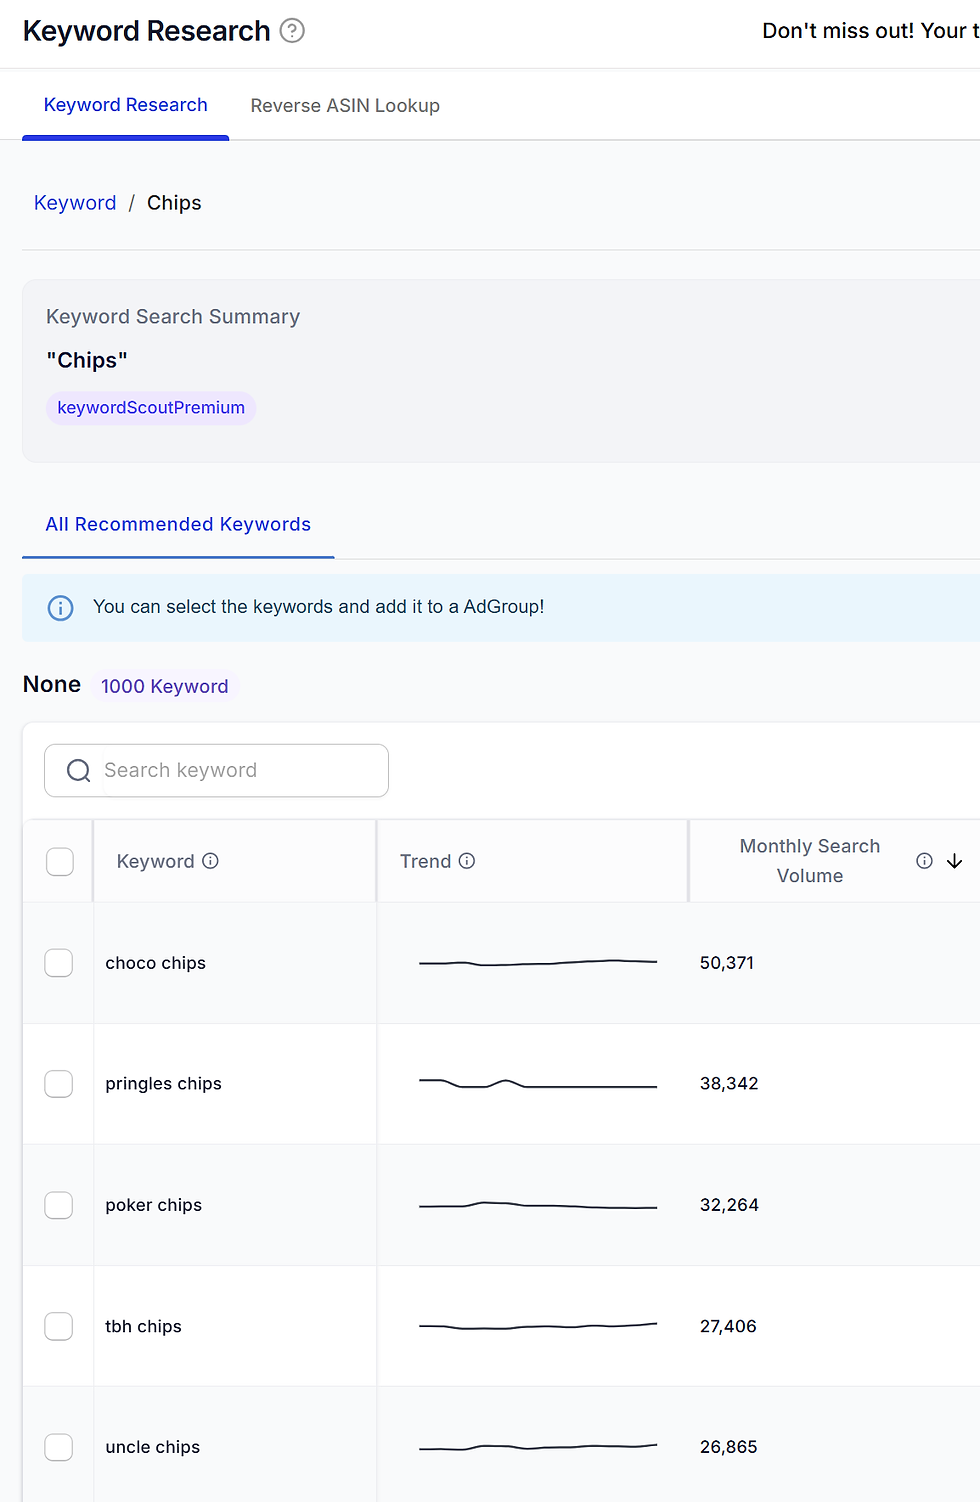
This includes:
Relevant keyword search volume
Category demand
Competitor sales
Seasonal demand
Branded and non-branded demand
2. How many orders can the product realistically win?
This depends on:
Search visibility
Advertising impression share
Organic ranking
Click-through rate (CTR)
Conversion rate (CVR)
Price competitiveness
Reviews and ratings
Stock availability
3. How much will acquiring those orders cost?
This depends primarily on:
CPC
Conversion rate
Advertising mix
Keyword competitiveness
Product-page performance
4. Will the resulting orders be profitable?
This depends on:
Contribution margin
CPA
ACoS
TACoS
Return rate
Discounts
Fixed overhead
A seller should not jump from “there are 20 lakh searches” to “I can generate 20 lakh in sales.” Demand, obtainable traffic, conversion and profitability are separate stages.
Important Amazon Profitability Definitions
What Is Contribution Margin?
Contribution margin is the amount left from an order after subtracting the variable costs required to produce, sell, fulfil and acquire that order. It indicates how much the order contributes towards fixed business expenses and profit.
For marketplace planning, sellers may calculate contribution margin both before and after advertising.
What Is Break-Even CPA?
Break-even CPA is the maximum advertising cost a seller can pay to acquire one order without making a contribution loss on that order. It is generally equal to the contribution available before advertising.
If a seller has ₹180 left before ad spend, spending more than ₹180 to acquire the order would normally create a contribution loss.
What Is Break-Even ACoS?
Break-even ACoS is the advertising-cost percentage at which ad-attributed sales stop producing a contribution profit. It is calculated by dividing contribution before advertising by ad-attributed revenue.
What Is TACoS?
TACoS, or total advertising cost of sales, measures advertising spend as a percentage of total Amazon revenue, including both advertised and non-advertised sales. It helps sellers understand how dependent total marketplace revenue is on paid advertising.
Step 1: Calculate Profit Per Amazon Order
Start with one unit rather than a monthly revenue target.
Use the following structure:
Item | Formula |
Selling price | What the customer pays |
Less: Discount | Coupon or promotional reduction |
Less: Product cost | Manufacturing or procurement cost |
Less: Packaging | Unit-level packaging expense |
Less: Amazon fees | Referral, closing and other applicable fees |
Less: Fulfilment | FBA, Easy Ship or self-shipping expense |
Less: Inbound logistics | Cost of sending inventory to the fulfilment point |
Less: Return allowance | Expected average return-related loss |
Contribution before ads | Amount available for advertising and profit |
Less: Advertising CPA | Cost of acquiring the sale |
Contribution after ads | Amount left before fixed overhead and tax |
Example
Assume the following hypothetical product:
Input | Amount |
Selling price | ₹749 |
Product and packaging cost | ₹250 |
Amazon and fulfilment fees | ₹165 |
Return and discount allowance | ₹34 |
Contribution before advertising | ₹300 |
The product has ₹300 available for advertising, fixed operating costs and profit.
If advertising CPA is ₹200:
Contribution after advertising = ₹300 − ₹200 = ₹100
If advertising CPA is ₹340:
Contribution after advertising = ₹300 − ₹340 = −₹40
The second order creates revenue but loses ₹40 before fixed overhead.
The maximum affordable advertising cost should be derived from unit economics, not selected from a generic target ACoS.
Step 2: Calculate CPA From CPC and Conversion Rate
Sponsored Products are cost-per-click ads, meaning the advertiser is charged for clicks rather than simply for displaying the product.
The basic formula is:
Estimated CPA = Average CPC ÷ Conversion rate
Suppose:
Average CPC: ₹15
Conversion rate: 5%
The calculation is:
₹15 ÷ 0.05 = ₹300 CPA
A 5% conversion rate means approximately one order for every 20 clicks. At ₹15 per click:
20 clicks × ₹15 = ₹300 per order
How Conversion Rate Changes CPA
CPC | Conversion Rate | Estimated CPA |
₹15 | 2% | ₹750 |
₹15 | 3% | ₹500 |
₹15 | 5% | ₹300 |
₹15 | 8% | ₹187.50 |
₹15 | 10% | ₹150 |
This table shows why improving the listing may be as important as reducing bids.
At the same CPC, moving from a 2% conversion rate to a 5% conversion rate reduces estimated CPA from ₹750 to ₹300.
A weak conversion rate makes every click more expensive, even when the CPC remains unchanged.
Step 3: Calculate Break-Even ACoS
Amazon defines ACoS as advertising spend divided by ad-attributed sales.
The formula is:
ACoS = Ad spend ÷ Ad-attributed sales × 100
Suppose:
Selling price: ₹749
Contribution before ads: ₹300
Then:
Break-even ACoS = ₹300 ÷ ₹749 × 100
Break-even ACoS = 40.05%
At an ACoS of approximately 40%, the product is around contribution break-even before fixed overhead and tax.
A lower ACoS produces a positive contribution. A higher ACoS creates a contribution loss, assuming the other costs remain unchanged.
Break-Even ACoS Example
ACoS | Advertising Cost on ₹749 Sale | Contribution After Ads |
20% | ₹149.80 | ₹150.20 |
30% | ₹224.70 | ₹75.30 |
40% | ₹299.60 | ₹0.40 |
50% | ₹374.50 | −₹74.50 |
60% | ₹449.40 | −₹149.40 |
This does not mean every campaign above break-even ACoS must be paused immediately. Some sellers may deliberately accept losses for a limited launch or strategic keyword. However, that decision should be planned, measured and capped.
Step 4: Calculate the Advertising Budget for a Sales Goal
A seller commonly starts with a statement such as:
“I want ₹1 lakh in monthly Amazon sales. How much should I spend?”
The required inputs are:
Revenue target
Average selling price
Percentage of sales expected from ads
Conversion rate
CPC
The formulas are:
Orders required = Revenue target ÷ Average selling price
Ad orders required = Orders required × Paid sales share
Clicks required = Ad orders required ÷ Conversion rate
Advertising budget = Clicks required × CPC
Worked Example: ₹1 Lakh Monthly Sales Target

Assume:
Monthly revenue target: ₹1,00,000
Average selling price: ₹989
Conversion rate: 2%
CPC: ₹15
Paid sales share: 100%
Orders Required: ₹1,00,000 ÷ ₹989 = approximately 101 orders
Clicks Required: 101 ÷ 0.02 = approximately 5,050 clicks
Advertising Budget Required: 5,050 × ₹15 = approximately ₹75,750
Daily Advertising Budget: ₹75,750 ÷ 30 = approximately ₹2,525 per day
This is a traffic-cost estimate, not a recommendation to spend ₹75,750.
The seller must still check whether the product can support the resulting
CPA: ₹15 ÷ 2% = ₹750 CPA
If the contribution before advertising is only ₹300, the planned traffic is financially unviable at the assumed CPC and conversion rate.
The seller would need to improve one or more of the following:
Increase conversion rate
Reduce CPC
Increase selling price
Reduce product or fulfilment cost
Generate more organic orders
Improve repeat purchase
Change the sales target
A More Realistic Model With Organic Sales
Not every order has to come from ads.
Suppose a seller expects 60% of the ₹1 lakh target to come from advertising and 40% from organic or repeat orders.
Inputs
Total revenue goal: ₹1,00,000
Paid revenue share: 60%
Ad-attributed revenue goal: ₹60,000
Average selling price: ₹989
Conversion rate: 5%
CPC: ₹15
Calculation
Ad orders required: ₹60,000 ÷ ₹989 = approximately 61 orders
Clicks required: 61 ÷ 0.05 = 1,220 clicks
Ad spend: 1,220 × ₹15 = ₹18,300
Daily budget: ₹18,300 ÷ 30 = ₹610 per day
The difference between ₹75,750 and ₹18,300 comes from two changes:
Paid sales contribution fell from 100% to 60%
Conversion increased from 2% to 5%
This demonstrates why there is no universal advertising budget for a ₹1 lakh revenue goal.
Step 5: Use TACoS to Understand Total Advertising Dependence
TACoS = Advertising spend ÷ Total Amazon revenue × 100
Example:
Ad spend: ₹20,000
Total Amazon revenue: ₹1,00,000
TACoS = 20%
ACoS and TACoS answer different questions.
Metric | Calculation | Main Question |
ACoS | Ad spend ÷ ad-attributed sales | How efficiently are ads producing attributed revenue? |
TACoS | Ad spend ÷ total Amazon sales | How dependent is total revenue on advertising? |
ROAS | Ad-attributed sales ÷ ad spend | How much attributed revenue is produced per ₹1 spent? |
Amazon describes ROAS and ACoS as alternative ways of presenting advertising performance, with ROAS expressing attributed return relative to spend and ACoS expressing spend relative to attributed sales.
Do Not Choose TACoS Before Calculating Margin
A new seller should not automatically select a TACoS target of 50%, 60% or 80%.
At 80% TACoS, a business spends ₹80 on advertising for every ₹100 in total Amazon revenue.
Most products cannot sustain that unless:
The seller is intentionally funding a temporary launch loss
The product has unusually high margins
Repeat purchases create future value
The business has defined a strict cash-loss limit
The spend is producing strategic gains that are being measured
A target TACoS should be an output of financial planning, not an arbitrary input.
Step 6: Estimate Amazon Sales Potential From Search Volume
Search volume is useful, but it should not be treated as a revenue forecast.
Suppose a tool reports:
Monthly search volume: 23,00,000
CTR: 2%
Conversion rate: 5%
Average selling price: ₹989
A simple calculation might produce:
23,00,000 × 2% × 5% = 2,300 orders
2,300 × ₹989 = ₹22,74,700 revenue
The arithmetic is correct, but the model assumes that the seller can participate in all 23 lakh searches.
That is rarely realistic.
The seller’s product may:
Be relevant to only part of the keyword set
Appear for only a fraction of searches
Lose placements to competitors
Have limited budget or inventory
Rank poorly for important terms
Receive a lower CTR than category leaders
A more useful formula is:
Estimated orders = Search volume × addressable demand share × impression share × CTR × conversion rate
Conservative Sales-Potential Example
Metric | Assumption |
Total category search volume | 23,00,000 |
Addressable demand share | 20% |
Impression share | 5% |
CTR | 1.5% |
Conversion rate | 5% |
Calculation: 23,00,000 × 20% × 5% × 1.5% × 5%
Estimated orders = approximately 173
At an average selling price of ₹989:
Estimated revenue = approximately ₹1,71,097
This is still an estimate, but it is more defensible because it accounts for obtainable visibility and customer response.
Search volume measures possible demand. It does not measure the amount of demand one seller will capture.
Where to Get the Data for the Calculator
The accuracy of the model depends on the quality of the inputs.
1. Amazon Advertising Reports
Use campaign and search-term reports for:
CPC
Spend
Clicks
Ad-attributed orders
Ad-attributed sales
ACoS
Conversion rate
Search terms
Use recent account data wherever possible rather than relying on generic category benchmarks.
2. Search Query Performance
Amazon’s Search Query Performance dashboard shows Brand Representatives how customers search for their brand and how the brand performs at the search-results stage.
It can help analyse:
Query-level impressions
Clicks
Cart additions
Purchases
Brand or ASIN performance
Amazon also notes that search-performance dashboards and advertising reports may define or attribute actions differently, so metrics from separate dashboards should not automatically be treated as identical.
3. Search Catalogue Performance
The Search Catalogue Performance dashboard provides catalogue-level funnel information, including how ASINs perform through stages such as impressions, clicks, cart additions and purchases.
4. Brand Analytics
Eligible sellers can access Brand Analytics under the Brands section of Seller Central. Available reports may include search and customer-behaviour information.
5. Third-Party Keyword and Product Tools
Tools such as Helium 10, SellerGeni and similar platforms can help sellers research:
Estimated search volume
Suggested bids
Keyword trends
Competitor listings
Sales estimates
Keyword relevance
Treat third-party numbers as directional estimates rather than audited marketplace totals.
6. Google Keyword Planner
Google Keyword Planner may help estimate demand and advertising costs for Google searches.
However:
Google search demand and Amazon shopping demand are not interchangeable.
Google data may show external customer interest, while Amazon data reflects activity within the marketplace. Use each source for its relevant channel.
7. Amazon Fee Calculator and Fee Schedule
Check current category, price and fulfilment charges before approving a product model.
Amazon’s fee pages state that total selling fees may include referral, closing, shipping and other applicable charges. The amount can vary by category, price and fulfilment approach.
Fee policies can also change over time. For example, Amazon India announced fee revisions effective from 16 March 2026, including referral-fee changes for eligible products and categories. Sellers should therefore use current fee schedules rather than an old spreadsheet assumption.
Build Three Scenarios Instead of One Forecast
A single forecast creates false confidence.
Build at least three versions.
Input | Conservative | Base Case | Optimistic |
CPC | ₹20 | ₹15 | ₹12 |
Conversion rate | 2% | 5% | 8% |
Estimated CPA | ₹1,000 | ₹300 | ₹150 |
Paid sales share | 80% | 60% | 40% |
Return allowance | Higher | Current average | Lower |
Organic visibility | Low | Moderate | Strong |
Conservative Scenario
Use this for:
Cash-flow planning
Inventory-risk decisions
Launch-loss limits
Worst-case viability
Base Scenario
Use:
Recent account CPC
Actual listing conversion rate
Current fee data
Expected organic contribution
Real inventory capacity
Optimistic Scenario
Use it to understand upside, but do not use it as the only inventory or funding plan.
A forecast should reveal the range of possible outcomes, not hide uncertainty behind one precise number.
How Much Should a New Amazon Seller Spend on Ads?
A new seller’s budget should be large enough to gather useful data but small enough to protect cash.
The budget should be based on:
Affordable CPA
Expected CPC
Clicks needed for meaningful evaluation
Inventory available
Launch-loss tolerance
Number of products and keywords
Expected conversion rate
There is no universal ₹500, ₹1,000 or ₹5,000 daily budget that suits every seller.
For example:
A ₹15 CPC and 5% conversion rate imply a ₹300 CPA.
A ₹25 CPC and 3% conversion rate imply approximately ₹833 CPA.
A product with only ₹250 contribution before ads cannot sustainably support the second scenario.
Amazon Sponsored Products campaigns do not require an upfront monthly fee; sellers set campaign budgets and bids.
The absence of a required minimum does not mean every budget is commercially sensible.
When Can a Higher ACoS Be Acceptable?
A seller may temporarily accept an ACoS above break-even when:
Launching a new product
Collecting initial conversion data
Testing new keywords
Supporting an important event or promotion
Defending branded searches
Building visibility for a high-repeat product
Attempting to improve organic placement
However, the seller should define:
Maximum loss per order
Maximum total launch loss
Test duration
Required number of clicks or orders
Success criteria
Stop conditions
A high ACoS is not automatically a strategy.
It becomes a strategy only when the seller understands what the loss is intended to achieve and how that outcome will be evaluated.
When Should You Reduce or Stop Amazon Advertising?
Reduce bids, pause targets or investigate the listing when:
CPA Consistently Exceeds the Affordable Limit
If break-even CPA is ₹300 and actual CPA remains ₹550, every ad-attributed order may be creating a contribution loss.
Search Terms Are Irrelevant
Clicks from unrelated searches consume budget without reaching the right customer.
The Listing Does Not Convert
A campaign may be driving qualified traffic, but the product page may have:
Weak images
Unclear benefits
Poor reviews
An uncompetitive price
Missing information
Slow delivery
Weak offer differentiation
Inventory Is Too Low
Advertising a product that cannot remain in stock may waste ranking momentum and create operational problems.
Promotions Destroy the Margin
A discount may increase conversion but reduce the contribution available to pay for ads.
Additional Spend Is Not Producing Incremental Sales
Increasing the budget does not always produce proportional growth. The seller may have exhausted the most efficient keywords or placements.
The Campaign Has No Clear Job
Each campaign should have a defined purpose, such as:
Discovering search terms
Scaling proven keywords
Targeting competing products
Defending the brand
Retargeting shoppers
A campaign without a clear objective is difficult to evaluate.
Common Amazon Profit and Budgeting Mistakes
Mistake 1: Treating Sales as Profit
₹5 lakh in revenue does not mean the seller earned ₹5 lakh.
Mistake 2: Using One Amazon Fee Percentage
Fees vary. Use actual category, price, fulfilment and shipping inputs.
Mistake 3: Entering Conversion Rate Incorrectly
In a spreadsheet, 2% should normally be entered as 2% or 0.02, not as 2.
Otherwise, a budget calculation can be wrong by a factor of 100.
Mistake 4: Assuming All Sales Will Come From Advertising
As organic ranking, repeat purchasing and brand demand improve, paid sales share may change.
Mistake 5: Treating Search Volume as Guaranteed Impressions
The product will obtain only a portion of category visibility.
Mistake 6: Setting ACoS From a Generic Benchmark
A profitable ACoS is determined by the seller’s own contribution margin.
Mistake 7: Ignoring Returns and Discounts
Returns, coupons and damaged inventory can materially change the true per-order contribution.
Mistake 8: Scaling Before Validating Conversion
More traffic can make a weak listing lose money faster.
A Practical Amazon Profitability Checklist
Before launching or scaling a product, confirm that you know:
Current selling price
Landed product cost
Current Amazon fees
Fulfilment cost
Return allowance
Contribution before advertising
Break-even CPA
Break-even ACoS
Average CPC
Expected conversion rate
Paid and organic sales mix
Monthly cash-loss tolerance
Inventory required
Conservative sales scenario
When several of these inputs are unknown, the answer to “How much can I make?” will remain speculative.
Frequently Asked Questions
How much can a new Amazon seller make in India?
A new Amazon seller can make anything from a loss to a profitable monthly income because earnings depend on product demand, selling price, costs, Amazon fees, conversion rate and advertising efficiency. Instead of using a standard income estimate, calculate contribution profit per order and multiply it by a realistic order range.
How much should I spend on Amazon ads?
Your Amazon advertising budget should be based on affordable CPA, expected CPC, conversion rate, sales target and the percentage of orders expected from ads. Use the formula: ad budget equals required ad orders divided by conversion rate, multiplied by CPC. Confirm that the estimated CPA remains below your allowable acquisition cost.
What is a good profit margin for an Amazon seller?
A good Amazon seller margin is one that covers product costs, Amazon fees, fulfilment, advertising, returns, discounts and business overhead while leaving an acceptable profit. There is no universal percentage because categories, prices, repeat-purchase rates and fulfilment costs differ. Calculate the required margin from your own cost structure.
How do I calculate break-even ACoS?
Calculate break-even ACoS by dividing contribution before advertising by ad-attributed selling price and multiplying by 100. If a ₹749 order leaves ₹300 before ads, break-even ACoS is approximately 40%. Spending above that level would normally create a contribution loss unless future value or organic effects justify it.
What is the difference between ACoS and TACoS?
ACoS divides advertising spend by ad-attributed sales, while TACoS divides advertising spend by total Amazon sales. ACoS measures campaign-level advertising efficiency. TACoS shows how much total marketplace revenue depends on advertising, including the effect of organic sales.
How do I estimate Amazon sales from search volume?
Estimate Amazon sales by multiplying relevant search volume by your addressable demand share, achievable impression share, expected click-through rate and conversion rate. Do not multiply total category search volume directly by CTR and conversion rate unless you can realistically appear in all those searches.
Can I rely on third-party Amazon search-volume data?
Third-party search-volume data should be treated as a directional estimate rather than guaranteed demand. Use it to compare keywords and build scenarios, then validate the assumptions with Amazon advertising reports, Search Query Performance, Brand Analytics, actual conversion rates and your product’s obtainable visibility.
When should I stop an unprofitable Amazon campaign?
Stop, reduce or restructure a campaign when CPA remains above the product’s affordable limit, search terms are irrelevant, conversion stays weak after sufficient traffic, stock is limited or promotional pricing removes the margin. Evaluate strategic launch campaigns against a predefined loss limit and test period rather than judging one day of results.
Conclusion on How Much Can You Make Selling on Amazon India
How much you can make selling on Amazon India depends on how many profitable orders your product can realistically generate—not the size of the category alone.
Start with unit economics.
Calculate the amount available before advertising. Use CPC and conversion rate to estimate CPA. Compare that CPA with your break-even limit. Then estimate obtainable traffic, order volume, cash requirements and inventory using multiple scenarios.
The process should move in this order:
Validate product margin.
Calculate break-even CPA and ACoS.
Estimate realistic demand.
Calculate the required ad budget.
Test with controlled spend.
Scale only after the economics hold.
Do not ask only how much revenue an Amazon product can generate. Ask how much profitable revenue it can generate and how much cash is required to reach it.
SellerScale works with Amazon sellers and D2C brands that need clearer product economics, PPC planning and profitable growth decisions. Use this framework to assess your current product, then speak with SellerScale to build a data-led Amazon advertising and profitability plan.


Comments